From Saturdays to Sundays: Do Wide Receiver Roles Carry Over from NCAA to the NFL?
Why
In dynasty circles this year, the wide receiver group has dominated the conversation. We have a clear case for the RB1, a clear case for the QB1, and then a much bigger debate around the top wide receivers in this class.
During wide receiver evaluations, we often talk about role, archetype, and fit. So I wanted to test whether college usage actually carries into the NFL. In theory, it should, but I wanted the data to tell me how true that really is.
Specifically, if a WR was used a certain way in college, does that usage show up again in the NFL?
What I Measured
I built a 12-zone usage map of the field for wide receivers. The field was split into four “depth” areas and three “horizontal” areas (sides of field).
Depth:
Behind the line of scrimmage, or BLOS
Short, 0-9 yards
Intermediate, 10-19 yards
Deep, 20+ yards
Horizontal areas:
Left
Center
Right
For each player, I calculated what percentage of his targets came in each zone. That matters because this is not team target share. I am not asking, “How much of the offense did he earn?” I am asking, “When this player was targeted, where on the field did those targets come from?” Targets are not perfect, but they are the best starting point for this question because they show where the player was actually being used in the passing game.
Zone Target Share =targets in that zone divided by total targets in the selected sample
The Sample
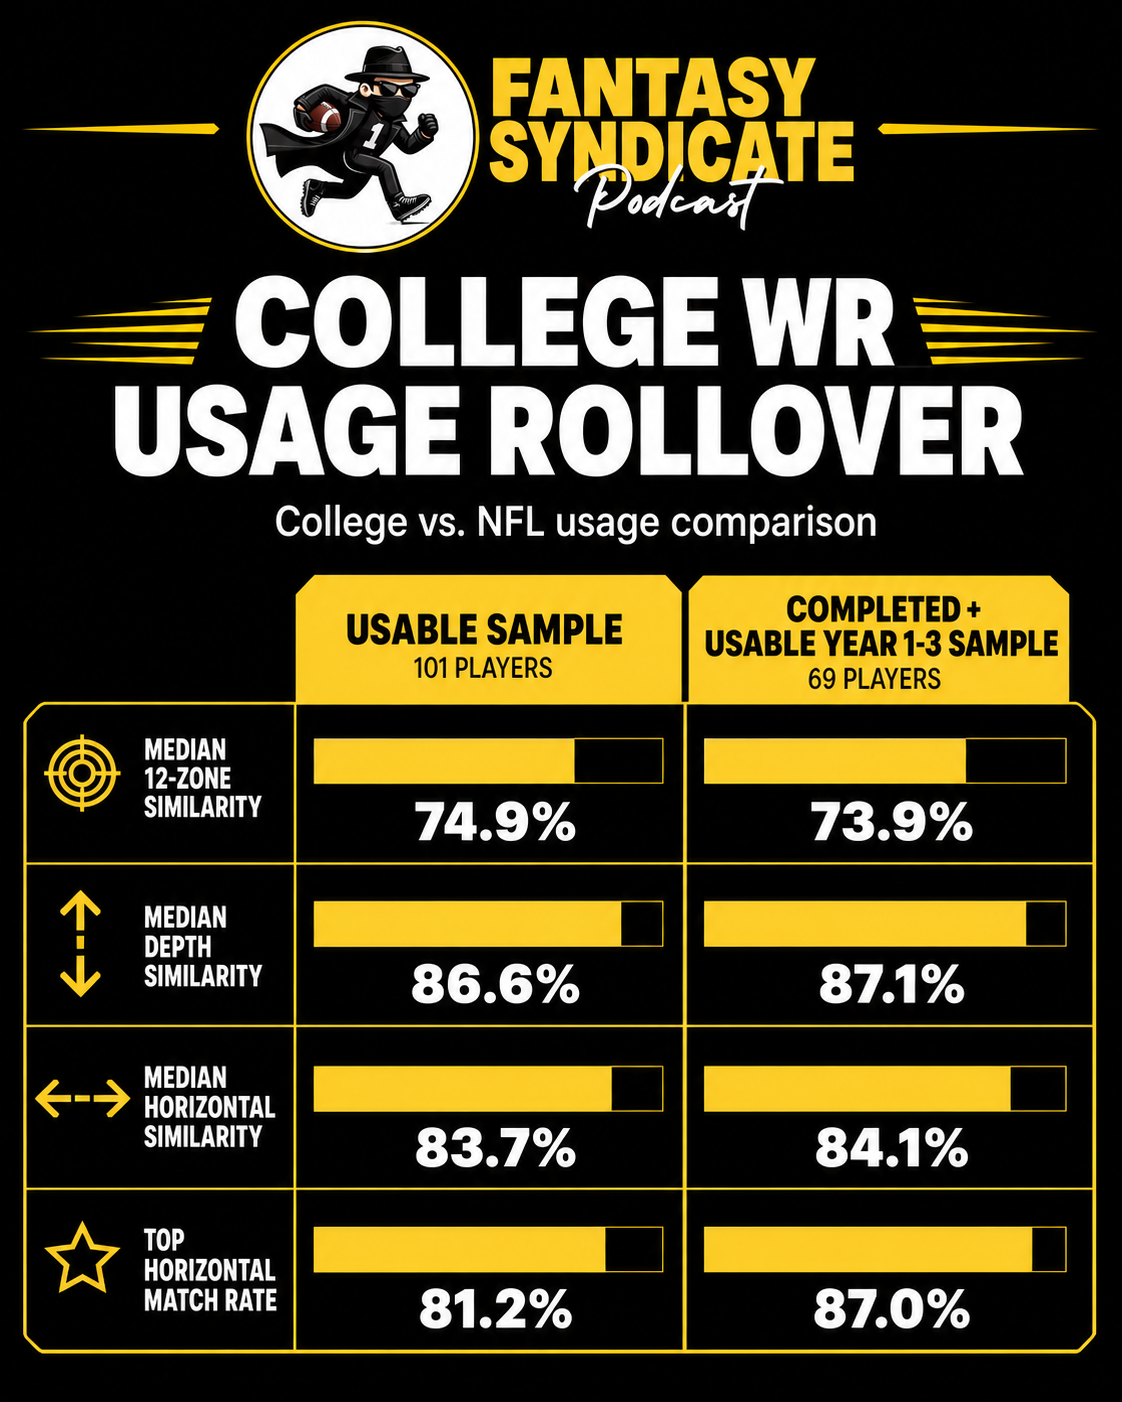
I tested drafted WRs from the 2020 through 2025 draft classes. The starting pool included 192 drafted wide receivers with college usage data. Of those, 178 matched to NFL receiving-depth data. That gave me the group I could use to compare college usage to NFL usage. For the main analysis, I removed low-volume NFL samples, which brought the usable group down to 101 wide receivers. For the cleanest Year 1-3 view, I narrowed it again to the 69 wide receivers who had enough NFL volume and a completed three-year window.
How I Measured Similarity
I compared the college and NFL target distributions using a distribution similarity score. The formula was, none of your business. Then I scaled it from 0 to 100. A score closer to 100 means the player’s college and NFL usage profiles were more similar. I calculated this three ways:
Full 12-zone similarity
Depth similarity (BLOS, Short, Intermediate, Deep)
Horizontal similarity (left-right-center)
This distinction mattered to me because a player may not match perfectly zone-by-zone, but he may still be used in a similar general depth area or horizontal. For example, a player may shift from short center to short right. That is not an exact 12-zone match, but it is still a similar depth role.
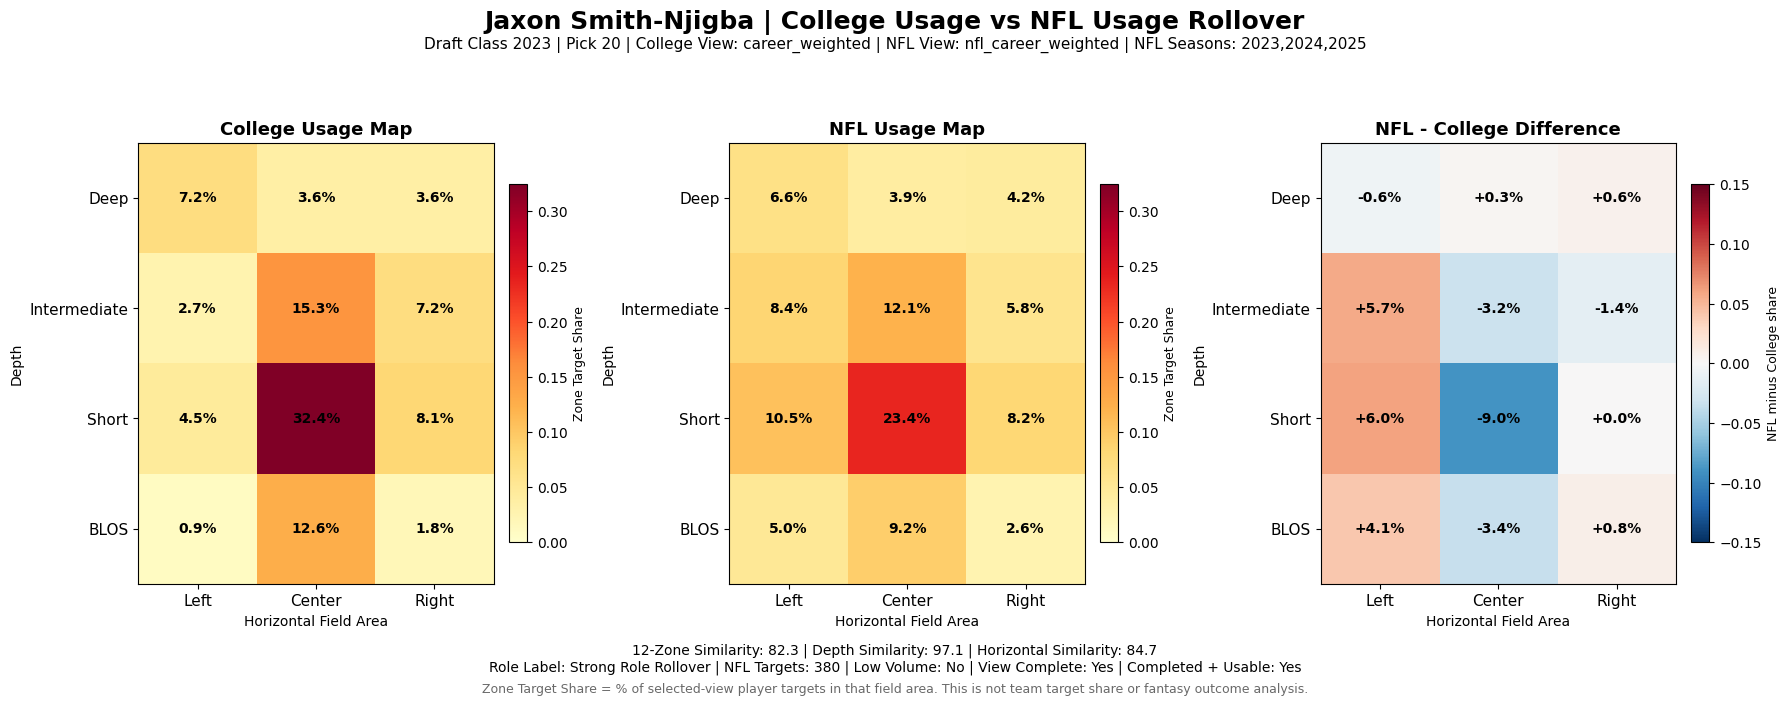
Jaxson Smith-Njigba College vs NFL Usage
What Did the Data Say?
The main finding was pretty clear: College WR usage does carry over directionally, but not perfectly by exact zone. The broader role structure was much more stable than the exact 12-zone profile.
This tells me the exact route/target map changes, but the broader player usage profile often remains recognizable at almost all levels.
The NFL Changes the Map, But Not the Identity
The NFL does reshape players. That showed up in the data, but reshaping is less about the wide receiver usage, and more about fitting into an NFL offense vs college. WRs generally became more short-area and less centered compared to their college profiles.
The biggest directional shifts:
Short-depth share rose from about 36.5% in college to 42.5% in the NFL
Deep share dropped from about 22.9% to 19.1%
Center-horizontal share dropped from about 56.1% to 45.2%
Left and right usage both increased
That makes sense. College offenses can feed dominant WRs in condensed areas of the field. NFL defenses are better. NFL route trees are different. NFL coordinators may use a player more horizontally, move him around, or ask him to win in more specific ways. So I would not say college usage carries over perfectly. But I would say college usage gives us a very useful starting point for understanding what kind of role a player will play in the offense.
Is Rookie-Year Usage the Closest to College?
I was curious about year 1 in the NFL for rookies, and my original thought was that year 1 usage might be the most college-like, then the role might drift away as the player develops and the offense grows or changes with new coordinators. But the data did not support that. It was actually the opposite.
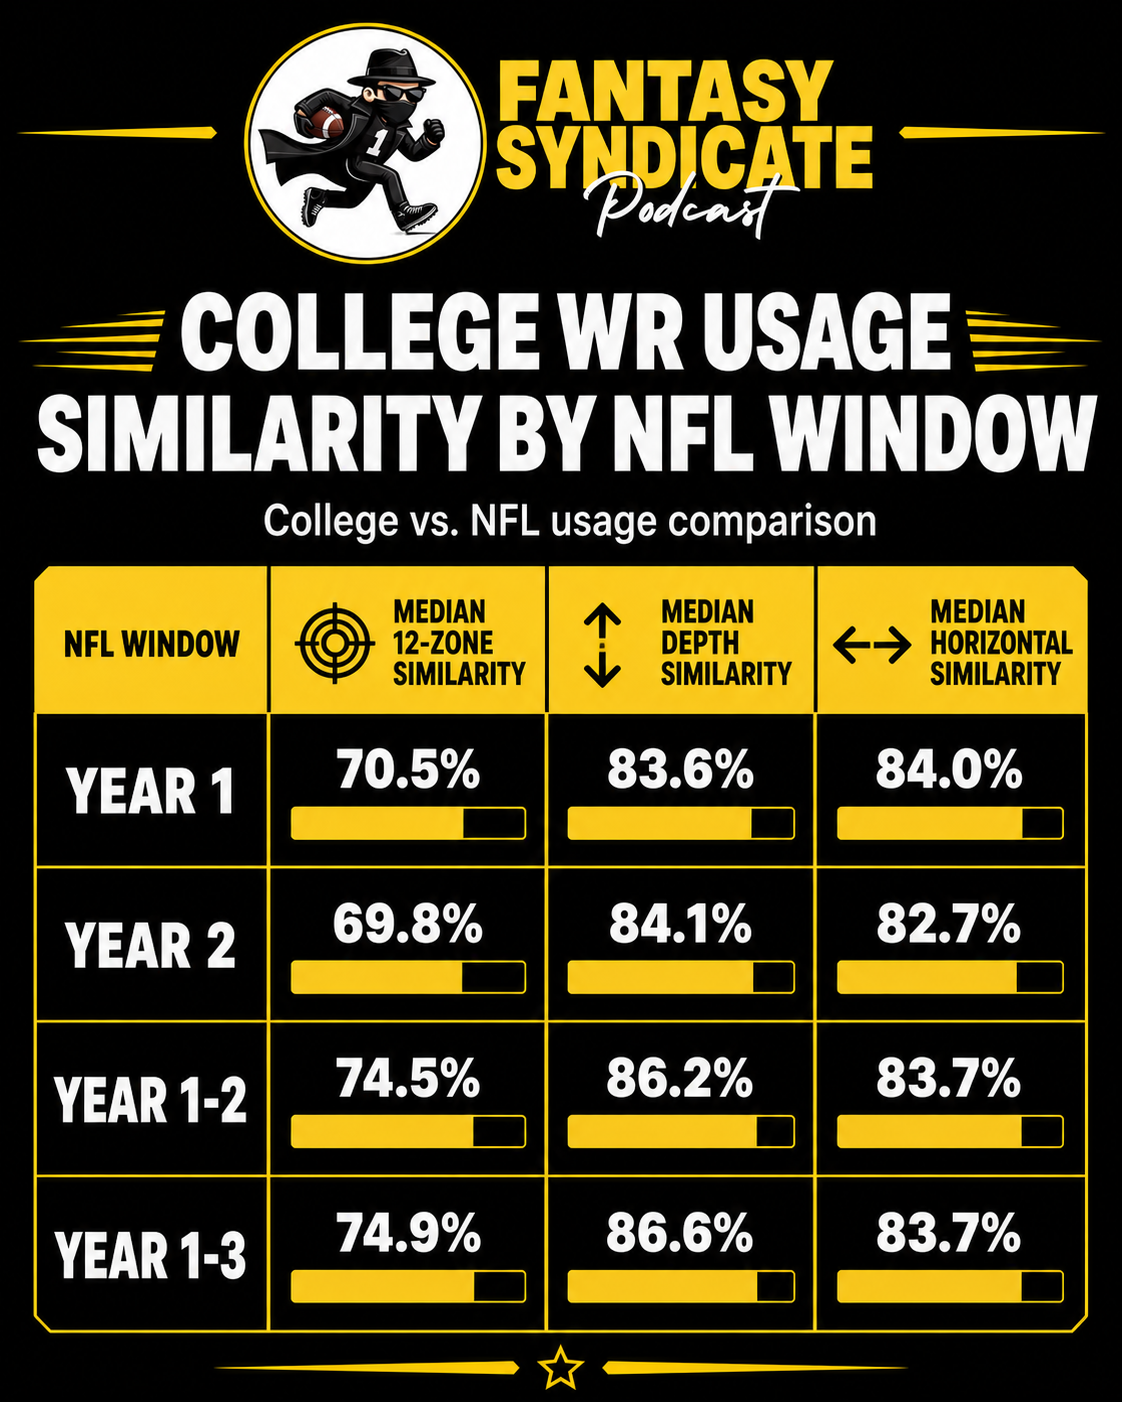
Rookie-year usage can be noisy. A larger NFL sample does a better job showing whether a player’s college role actually carried over. As time progressed, these receivers started to slowly align closer to their college usage.
What This Means for WR Evaluation
I think the biggest takeaway is, college usage should matter, but it should be treated as context, not destiny. If a WR wins in a certain area of the field in college, it is worth asking whether that role is likely to exist for him in the NFL. Do the offensive coordinators habits align? Does the starting quarterback throw to that part of the field consistently? Is there another player that already fills this role?
But we should not expect a perfect copy-and-paste translation. The NFL certainly changes things, but this test shows college usage is not random noise. The broader profile often carries over, especially by depth and horizontal usage.
For me, this becomes another layer of the prospects profile. For example…
Makai Lemon
Philadelphia Eagles, Draft Pick 20
A great example of using this context is Makai Lemon. Twitter has been ablaze about Lemon and his landing spot. The Eagles have been a run-first offense that historically hasn’t used their slot receiver heavily. Even with the A.J. Brown trade rumors looming, Lemon is still a slot wide receiver. Everything we just learned tells us that wide receivers don’t usually become completely different players in the NFL.
Then the Eagles drafted Eli Stowers, a tight end, with pick 54. Stowers shows similarities to Lemon in the receiving game. It was a very interesting offensive draft for the Eagles, and I’ll be curious to see how Sean Mannion plans to use all these weapons in his scheme. The comparison of Lemon’s college usage, Jalen Hurts’ passing habits, and the Eagles’ offensive history is all context to be aware of. But how accurate is it?
Below is a visual of Makai Lemon’s usage map. The common concern is that Jalen Hurts does not throw to the middle of the field often, which matters because Lemon was heavily used there in college. This is 100% accurate. As you can see Hurts is ranked 43/45 eligible QBs for passing in the middle of the field.
But that is not the full picture. Lemons depth similarity sits at 84%. In 2025, Hurts also ranked 5th in 2025 in short-yardage (depth) passes. This is an area where Lemon wins. While the fit is far from ideal, it isn’t all bad.
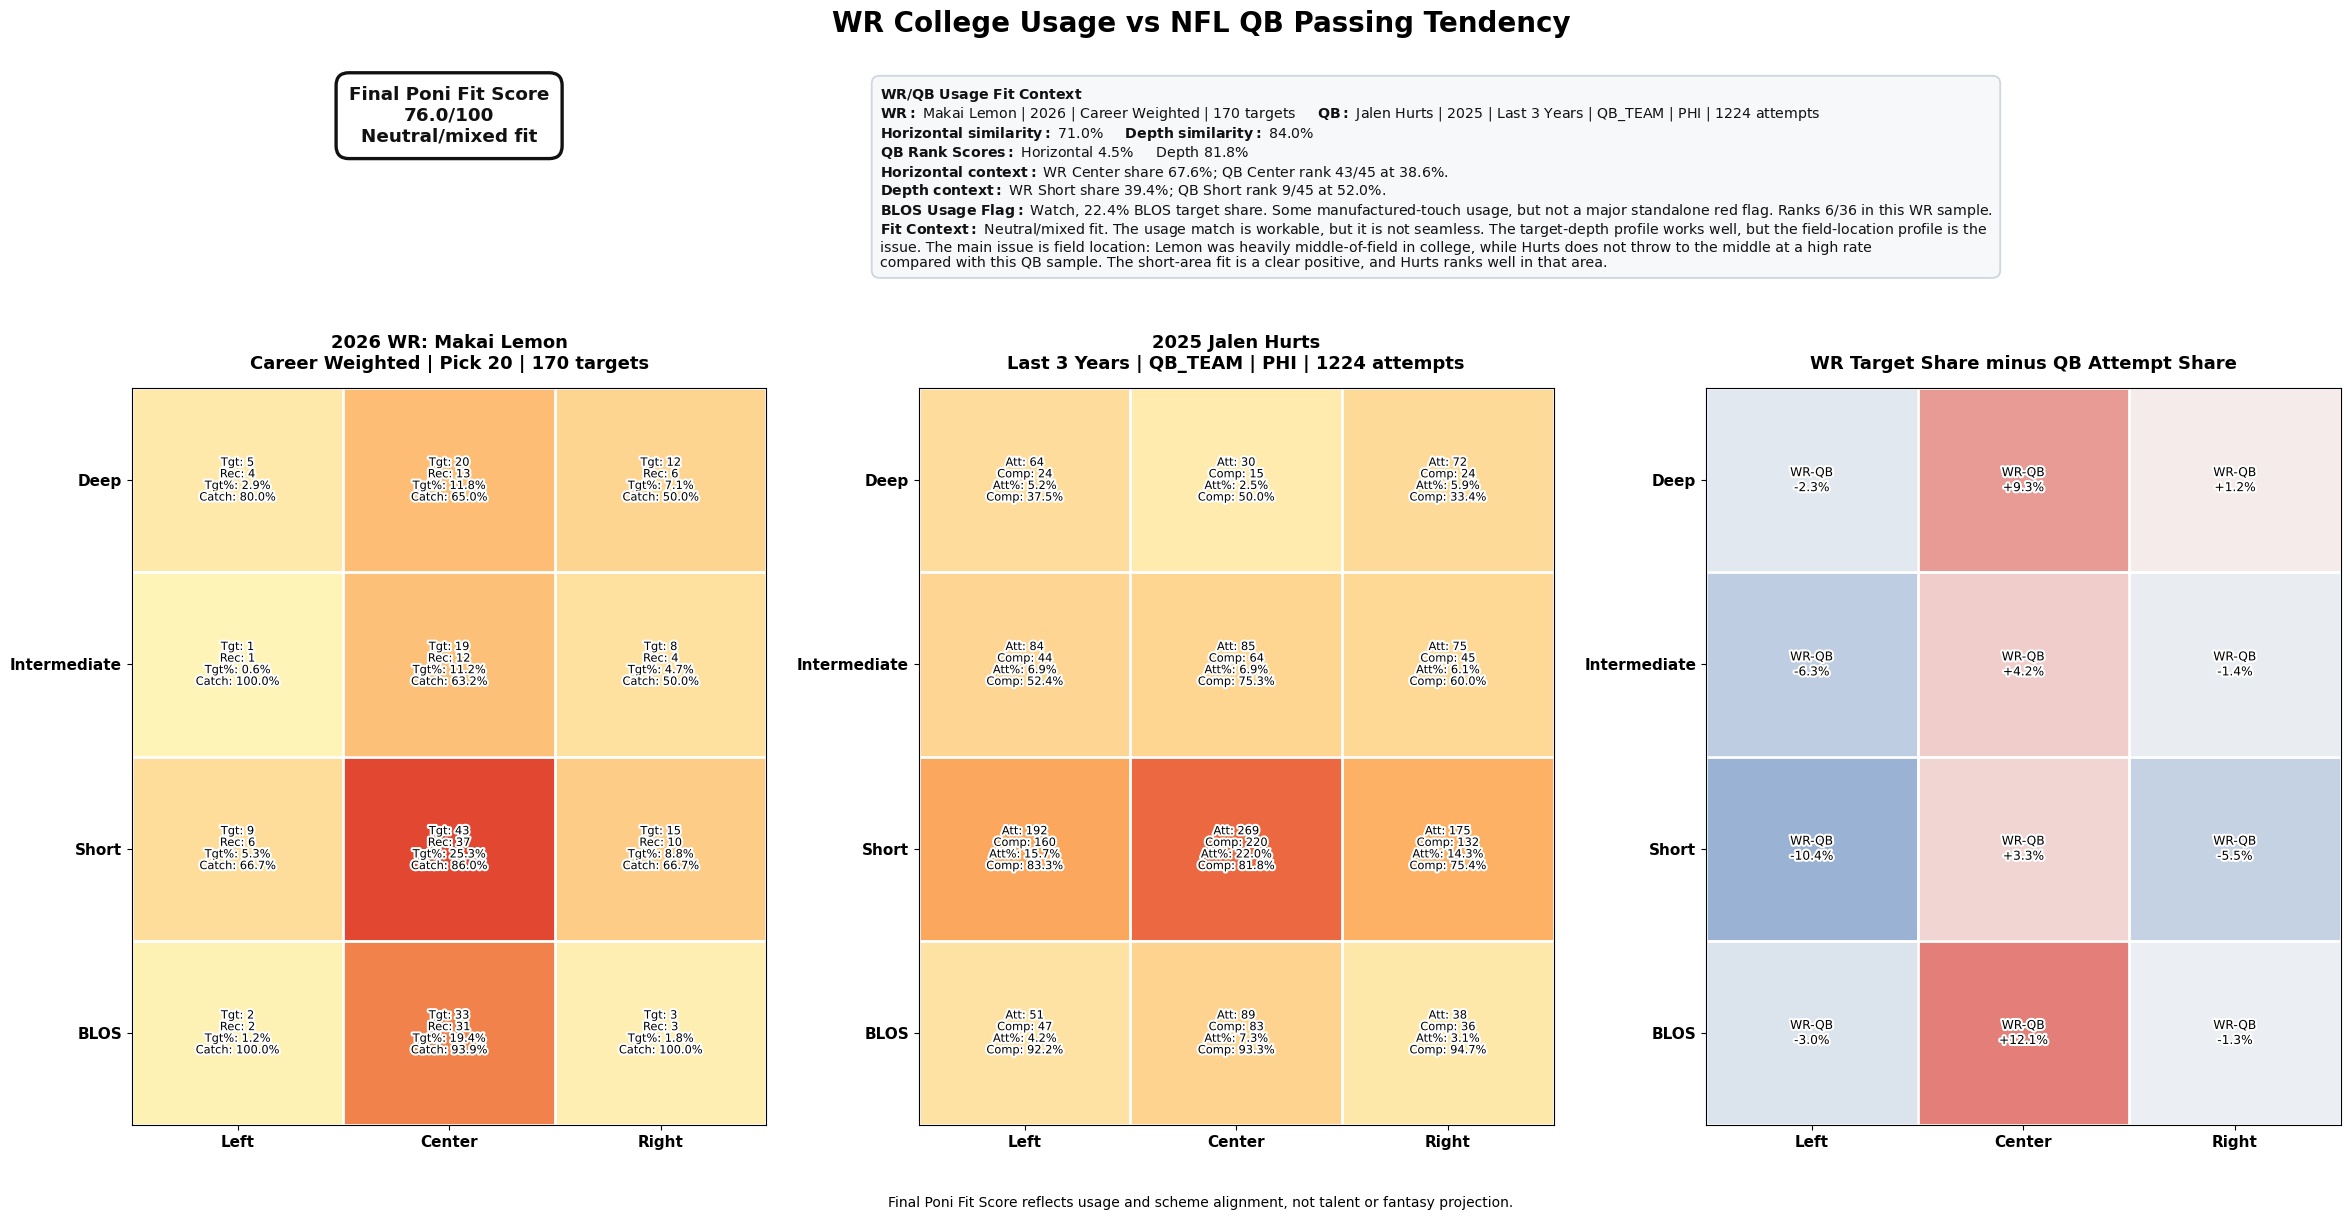
Makai Lemon & Jalen Hurts Usage
How Did I Come Up With The Poni Fit Score?
Without giving too much away, it was built by comparing a wide receiver’s college usage profile to the passing tendencies of their projected NFL quarterback/team. The goal was not to create a talent score or a fantasy projection. It was to answer a more specific question:
Does this receiver’s college role naturally match the way his new offense passes the ball?
To test that, I looked at historical wide receivers from 2020–2025 and compared their college usage to their actual NFL usage. The goal was to see whether a receiver’s role carried over by field location, including horizontal usage and depth usage.
Once that showed carryover, I tested how those WR usage profiles fit with QB passing tendencies. After testing 170+ weighting combinations, I landed on the formula that performed best for my Poni Fit Score.
The final formula showed a Pearson correlation of 0.5465, a Spearman correlation of 0.5399, and an R² of 0.2987 against actual broad usage rollover. In the completed sample, the Pearson correlation held at 0.5401.
I also tested the below thresholds to determine what would be the best fit without overtuning. These are my score ranges.
Strong fit, 85+
The WR’s college usage profile lines up very well with the QB/team passing tendency. His role should not require a major usage adjustment based on WR profile.Good fit, 78–84.9
The WR has a clear usage match with the QB/team, but it is not perfect. The main parts of his role translate well, though there may be one area where the fit is less clean.Neutral/mixed fit, 70–77.9
The fit is workable, but there are clear differences between the WR’s college usage and the QB/team passing profile. The WR may need to make adjustments, QB tendencies may need to change, or offensive scheme needs to change to best utilize the players strengths.Questionable fit, below 70
The WR’s college usage profile does not cleanly match the QB/team passing tendency. This could signal a significant role adjustment, usage uncertainty, or a much less natural scheme fit.
The Poni Conflict Card
After that I started to think about opportunities, and how a rookies situation plays a big part in their success in their first year. I had all this great data about usage maps available, why not use it? I took the time to map all the NFL wide receivers during this same 2020 - 2025 window. Using my 12-zone model (zone, depth, horizontal), include alignment context, role overlap, and target share, I came up with a model. I tested 50 different weighted combinations. This is far from perfect as well, but it uses the data to drive the results.
I wanted to answer two questions:
Who is the biggest single role/target obstacle for this player? Is there a clear path to WR1 or WR2 production? Then the Poni Conflict Card was created.
Poni Conflict Pressure Thresholds (Best to Worst):
Below 15.0: Low conflict pressure
15.0–17.49: Light conflict pressure
17.5–19.99: Moderate conflict pressure
20.0–22.49: Strong conflict pressure
This is the first true red-flag range based on testing. Players who crossed the 20.0+ threshold averaged 2.8 - 4 percentage points lower in year 1 target share. While that may seem small, it can have a real impact on a rookie’s first-year fantasy production when they are already fighting for opportunities.
22.5–24.99: Severe conflict pressure
25.0+: Extreme conflict pressure
Target share plays a part in the score, but this is where my model is different. I am also looking at the player role, usage map, profile/archetype, and the entire environment.
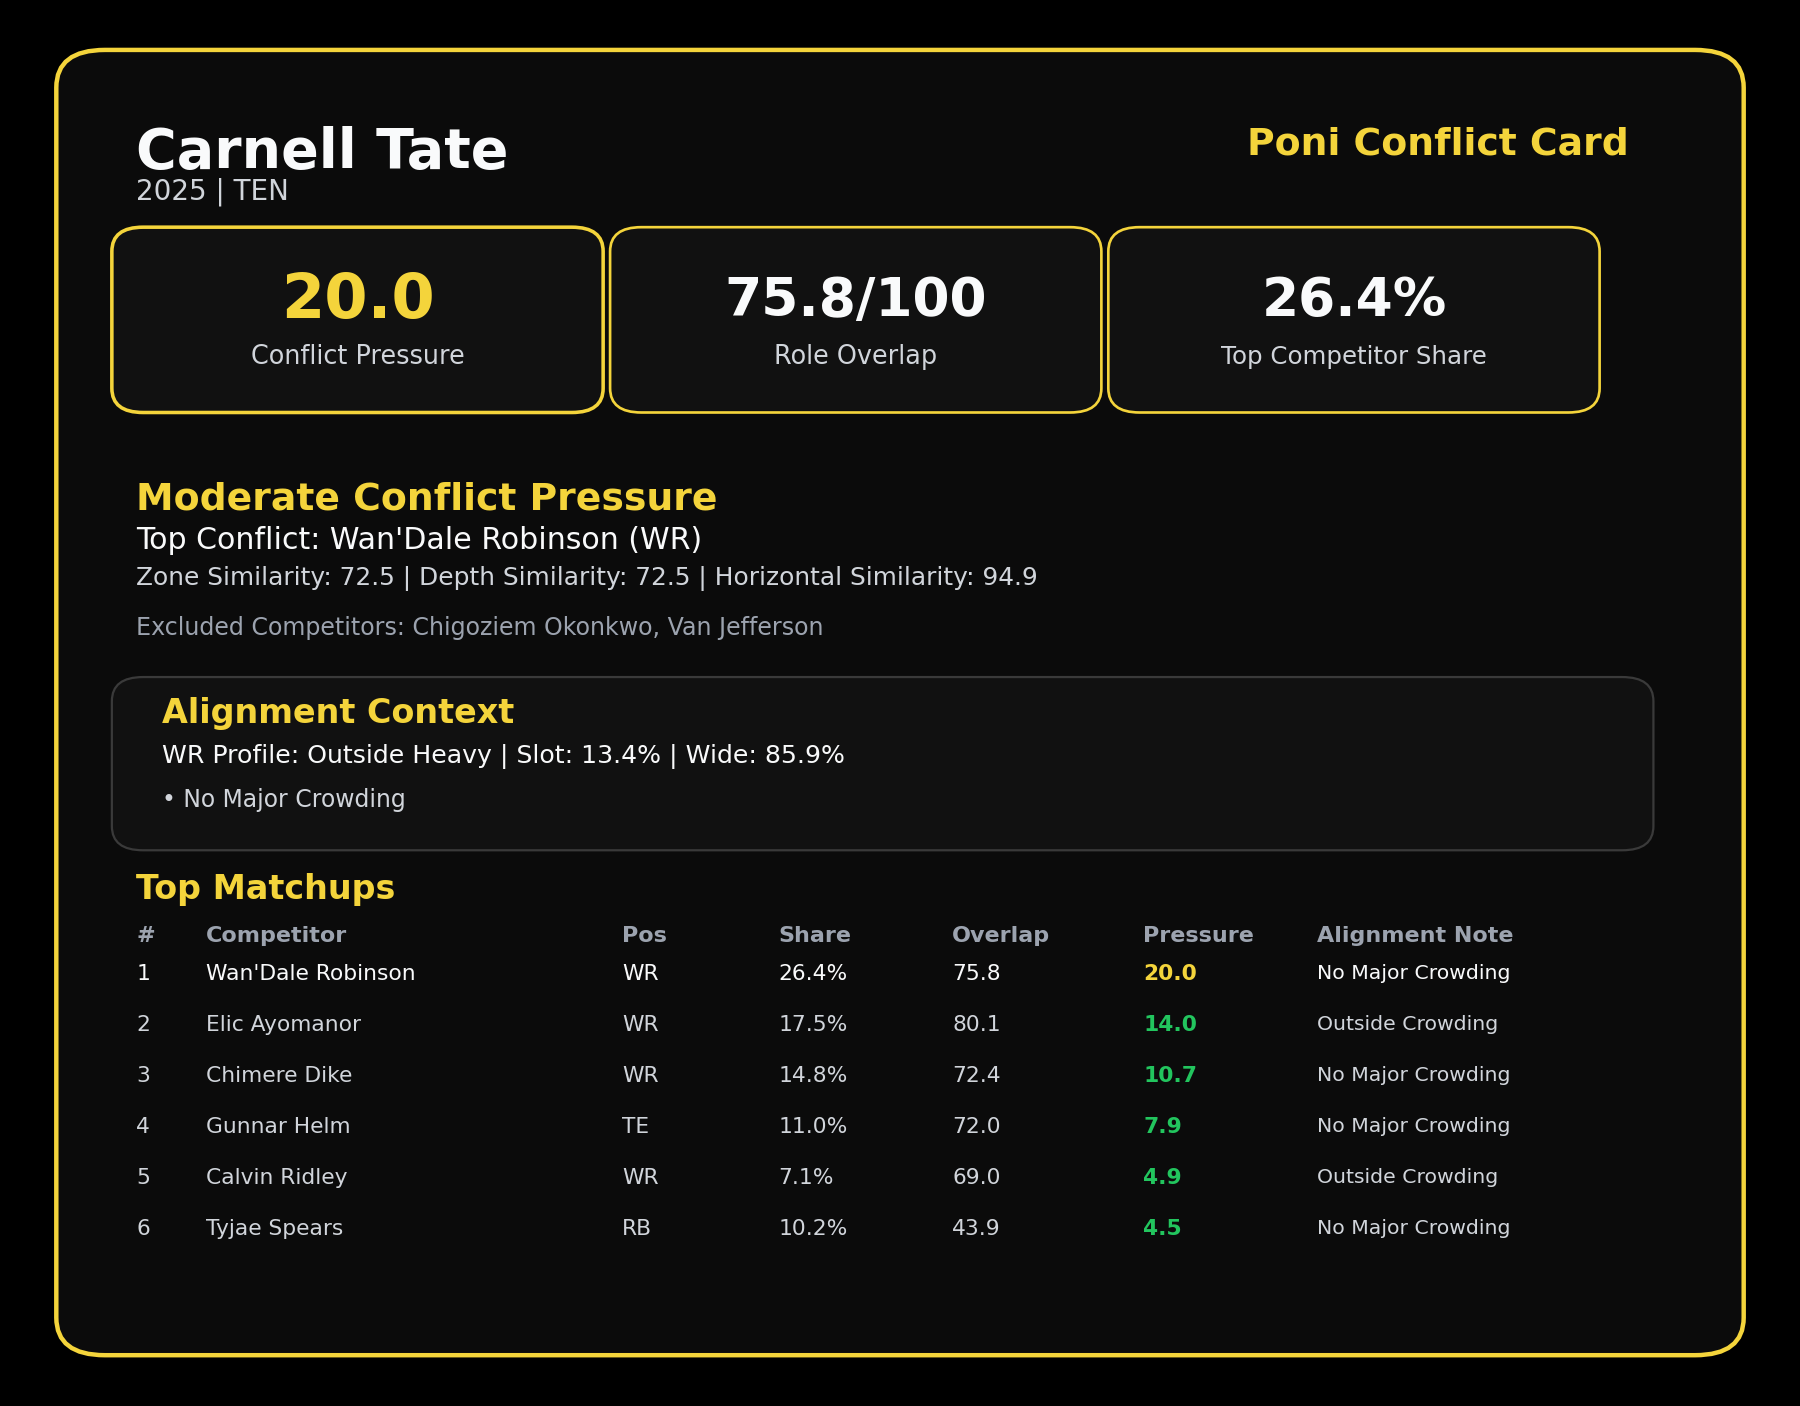
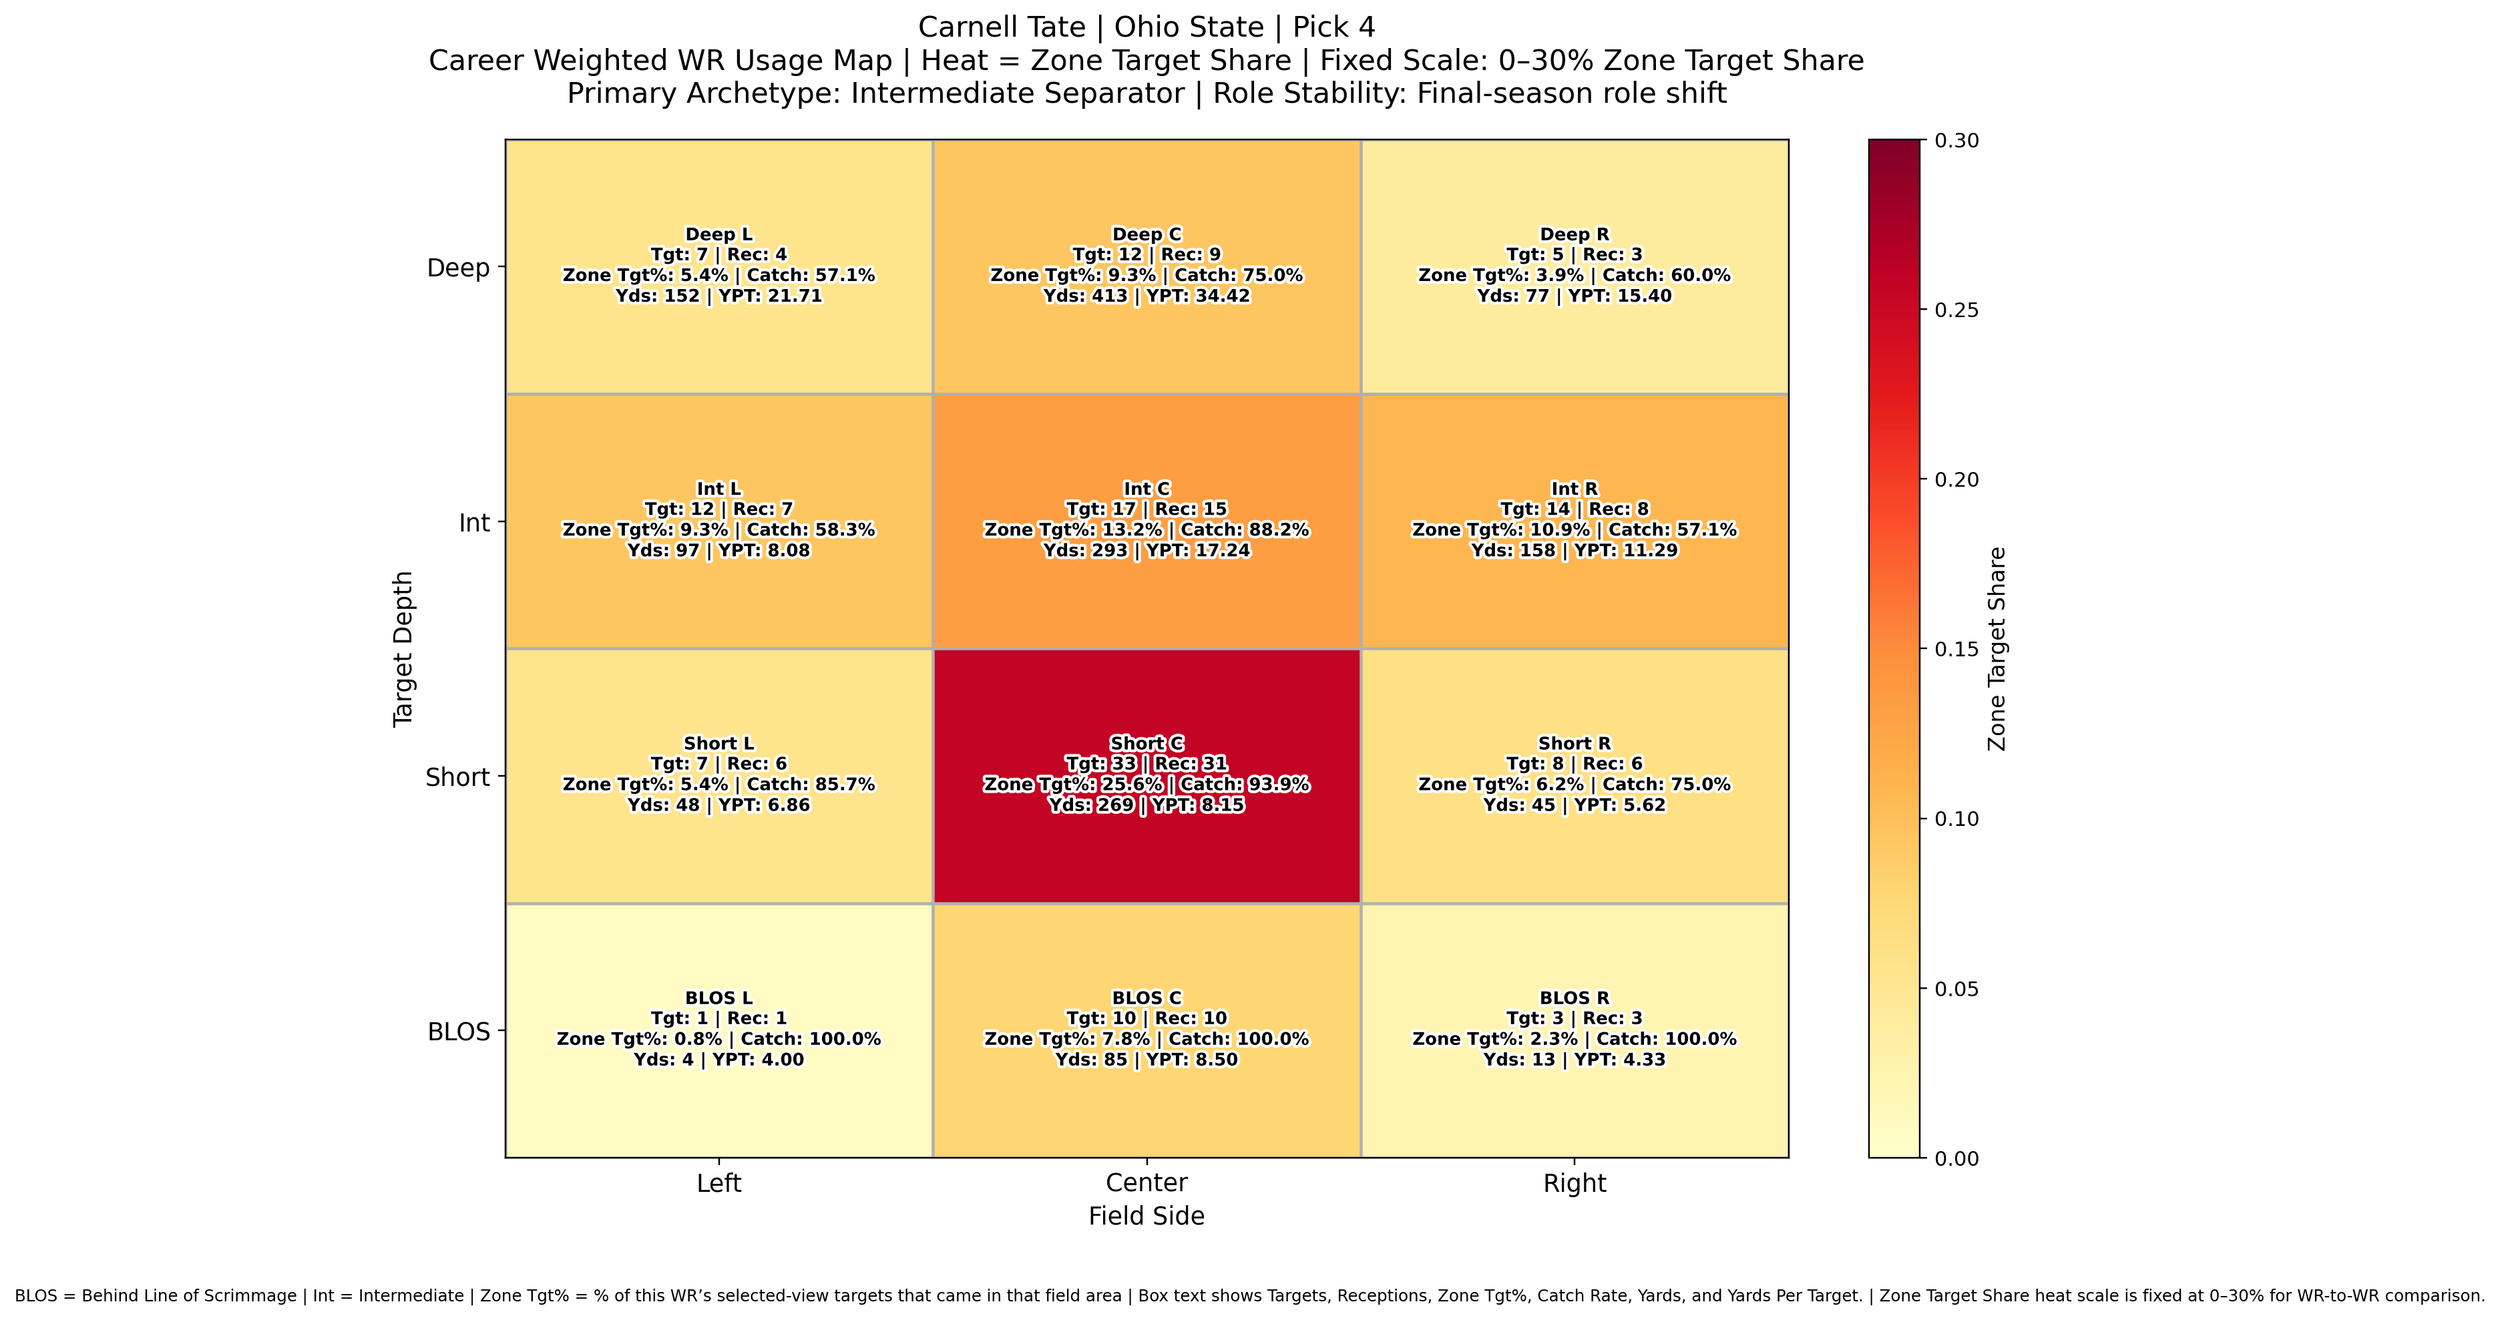
Carnell Tate Poni Conflict Card
Conflict Pressure is the main score on the card. It combines how similar the selected player is to an existing player in the offense with how much target share that existing player already owns or can be changed based on future projections. A higher Conflict Pressure means more role friction. A lower Conflict Pressure means less direct role competition. A score of 20.0 or higher is where I start treating the landing spot as a real conflict concern.
Role Overlap measures how similar the selected player’s usage profile is to the environment. Identifying the top player already in that offense that overlaps in usage while showing other conflicts on the card. It is scored from 0 to 100. A higher number means a more similar role.
As we can see above, Wan'Dale Robinson is much more of a conflict than most might believe for Tate.
If you are interested here is the 2026 WR class fit score, check it out!
Thanks for hanging out. If you want to show support go ahead and give us a follow on Youtube, Spotify, Twitter, or Reddit.
The way you win a fantasy championship and get an advantage isn’t by using platforms like FantasyPros. It’s by listening to the little guys that no-one else is. That’s your advantage.
Now go steal a championship!